Line-by-line debugging
Line-by-line visual debugging in VS Code with lldb
In the debugging video, notice that the line highlighted in yellow is the line to be executed. After you step in or step over the line, the result of executing that line is shown. The variables panel will update and any output will be shown in the debugging console.
Clang-14 and debugging symbols
When compiling by hand, you'd include -g to have the compiler write debugging symbols. For
the version of clang++ that we're using (v. 14.0.5), DWARFv5 debug format is used by default.
Unfortunately,some of our tools will not properly read the DWARF5 generated by
clang-14. Therefore, instead of using the -g flag, use -gdwarf-4. If you're using make,
you might need to update the Makefile to use -gdwarf-4 instead of -g.
Using the CS 128 environment debugger
For this class's MPs
You must open the Machine Problem in its window for things to work. After that,
you must compile the Machine Problem with debugging symbols (use the -gdwarf-4 flag), and
the resultant executable must be named exec and placed in the bin folder.
For your own projects
If you're interested in using our debugger on your own projects, make sure that you open your project in its own window, compile your project with debugging symbols (use the-gdwarf-4 flag),
name the resultant executable exec, and place exec in a folder named bin
in the project's root directory. Finally, make sure your project's root directory contains a
.vscode folder with the
files found here.
Debugger Actions
To use the debugger, you must understand its actions. Here are the buttons available to us in the VS code debugger.
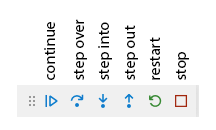
Please answer the following questions to communicate your understanding of their usage. If you're unsure, open up your CS 128 development environment and tinker with the provided Howdy World example.